# Racing Model
- What: This is a model I built for a university assignment to predict the outcome of Australian Horse Races. For the record I think racing is unethical and I do not endorse this "sport".
- When: 2016 - 2017
# Approach
# Data
To get the data for this analysis I used a website called Racenet which had information on all Australian races since 2008. I wrote a python script to scrape all the data from every race on the website as well as data on every horse. After scraping, cleaning and creating new variables I was left with a dataset with 1.5 million rows and 25 columns where every row corresponded to an instance of a specific horse running in a specific race. There were three types of variables:
- Horse-Specific (age, weight the horse is carrying, the barrier the horse is running from etc.)
- Race-Specific (distance, race prize pool etc.)
- Response (position, margin, etc.)
# Form
Next I wanted to quantify the concept of “form”. Knowing the age, gender and weight of a horse is useful when trying to predict the outcome of a race, but one of the most important factors is previous results. This is difficult for two main reasons:
- Each horse has run a different number of previous races.
- Not all races are equally competitive. Consider a two horse race where both horses came second in their last event. If the first horse’s previous race was the Melbourne Cup and the second horse’s was a small Maiden event in a country town, it would be wrong to consider their form as being equal.
To capture form I wrote an algorithm with Luke Tsekouras which was loosely based on Google’s Page Rank algorithm (this is similar to the algorithm used in my NRL Form Visualisation). The steps in the process were:
- Create set of all unique horse names in the dataset from before the specified date and assign an initial score of 0 to all horses.
- To update the form score for a given horse (say Horse X), find all their previous races
- For each of these races, consider every other horse in that race
- For each of these horses, add their current form score to the difference in margin between themselves and Horse X (for the relevant race)
- Horse X’s new form score is the average of this value for all horses it has raced against in the past
- Repeat steps 2 to 5 for all horses until every form score has been updated
- Calculate the Euclidean distance between this new set of scores and the previous one
- Repeat steps 6 and 7 until the scores converge
# Model
For this task I used a simple feed-forward neural network with 2 hidden layers. The model properties were:
- Inputs: Form, Sex, Age, Weight, Barrier, Race Distance, Track Rating, Prize Money
- Output: Log(Margin) (distance behind 1st place as 1st place crossed the finish line)
- Activation Function: ReLU
- Optimisation Function: SGD
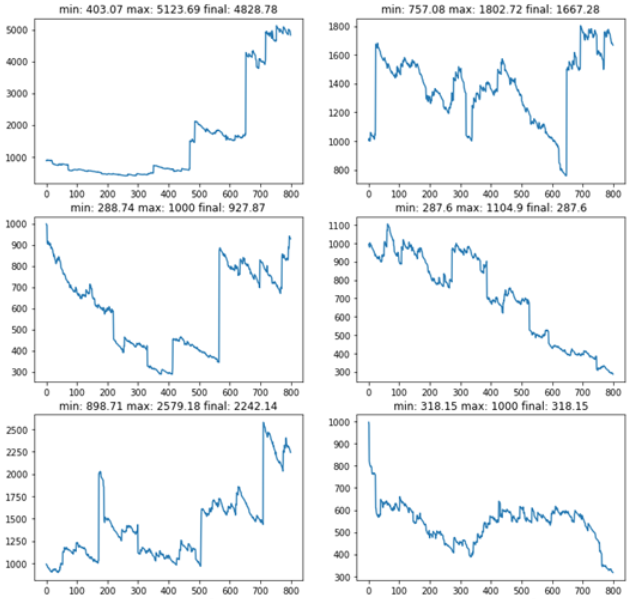
To assess the model I simulated betting on unseen historical races (races that were not used to train the model). The betting strategy involved betting on the horse with the lowest predicted margin in each race and choosing the bet size based on the difference between the lowest predicted margin and the 2nd lowest predicted margin. I also only bet on races where the prize pool was greater than $100000 since these were more predictable.
I simulated running this model with a test set of ~800 races which is the equivalent of using this betting model in the real world for about 2 years (examples shown below). The simulations showed that on average, after 2 years you would make a profit of 37%. Unfortunately there was a high level of variance between simulations and after 2 years some models did end in a loss, so even though on average you make a profit, you would probably need to use this strategy for decades to be confident of making a profit.